Business Growth
How UI/UX Directly Influences Business Revenue Growth
Welcome to the reality where good design isn't just aesthetic it's the difference between a product that prints money and one that bleeds users at checkout.

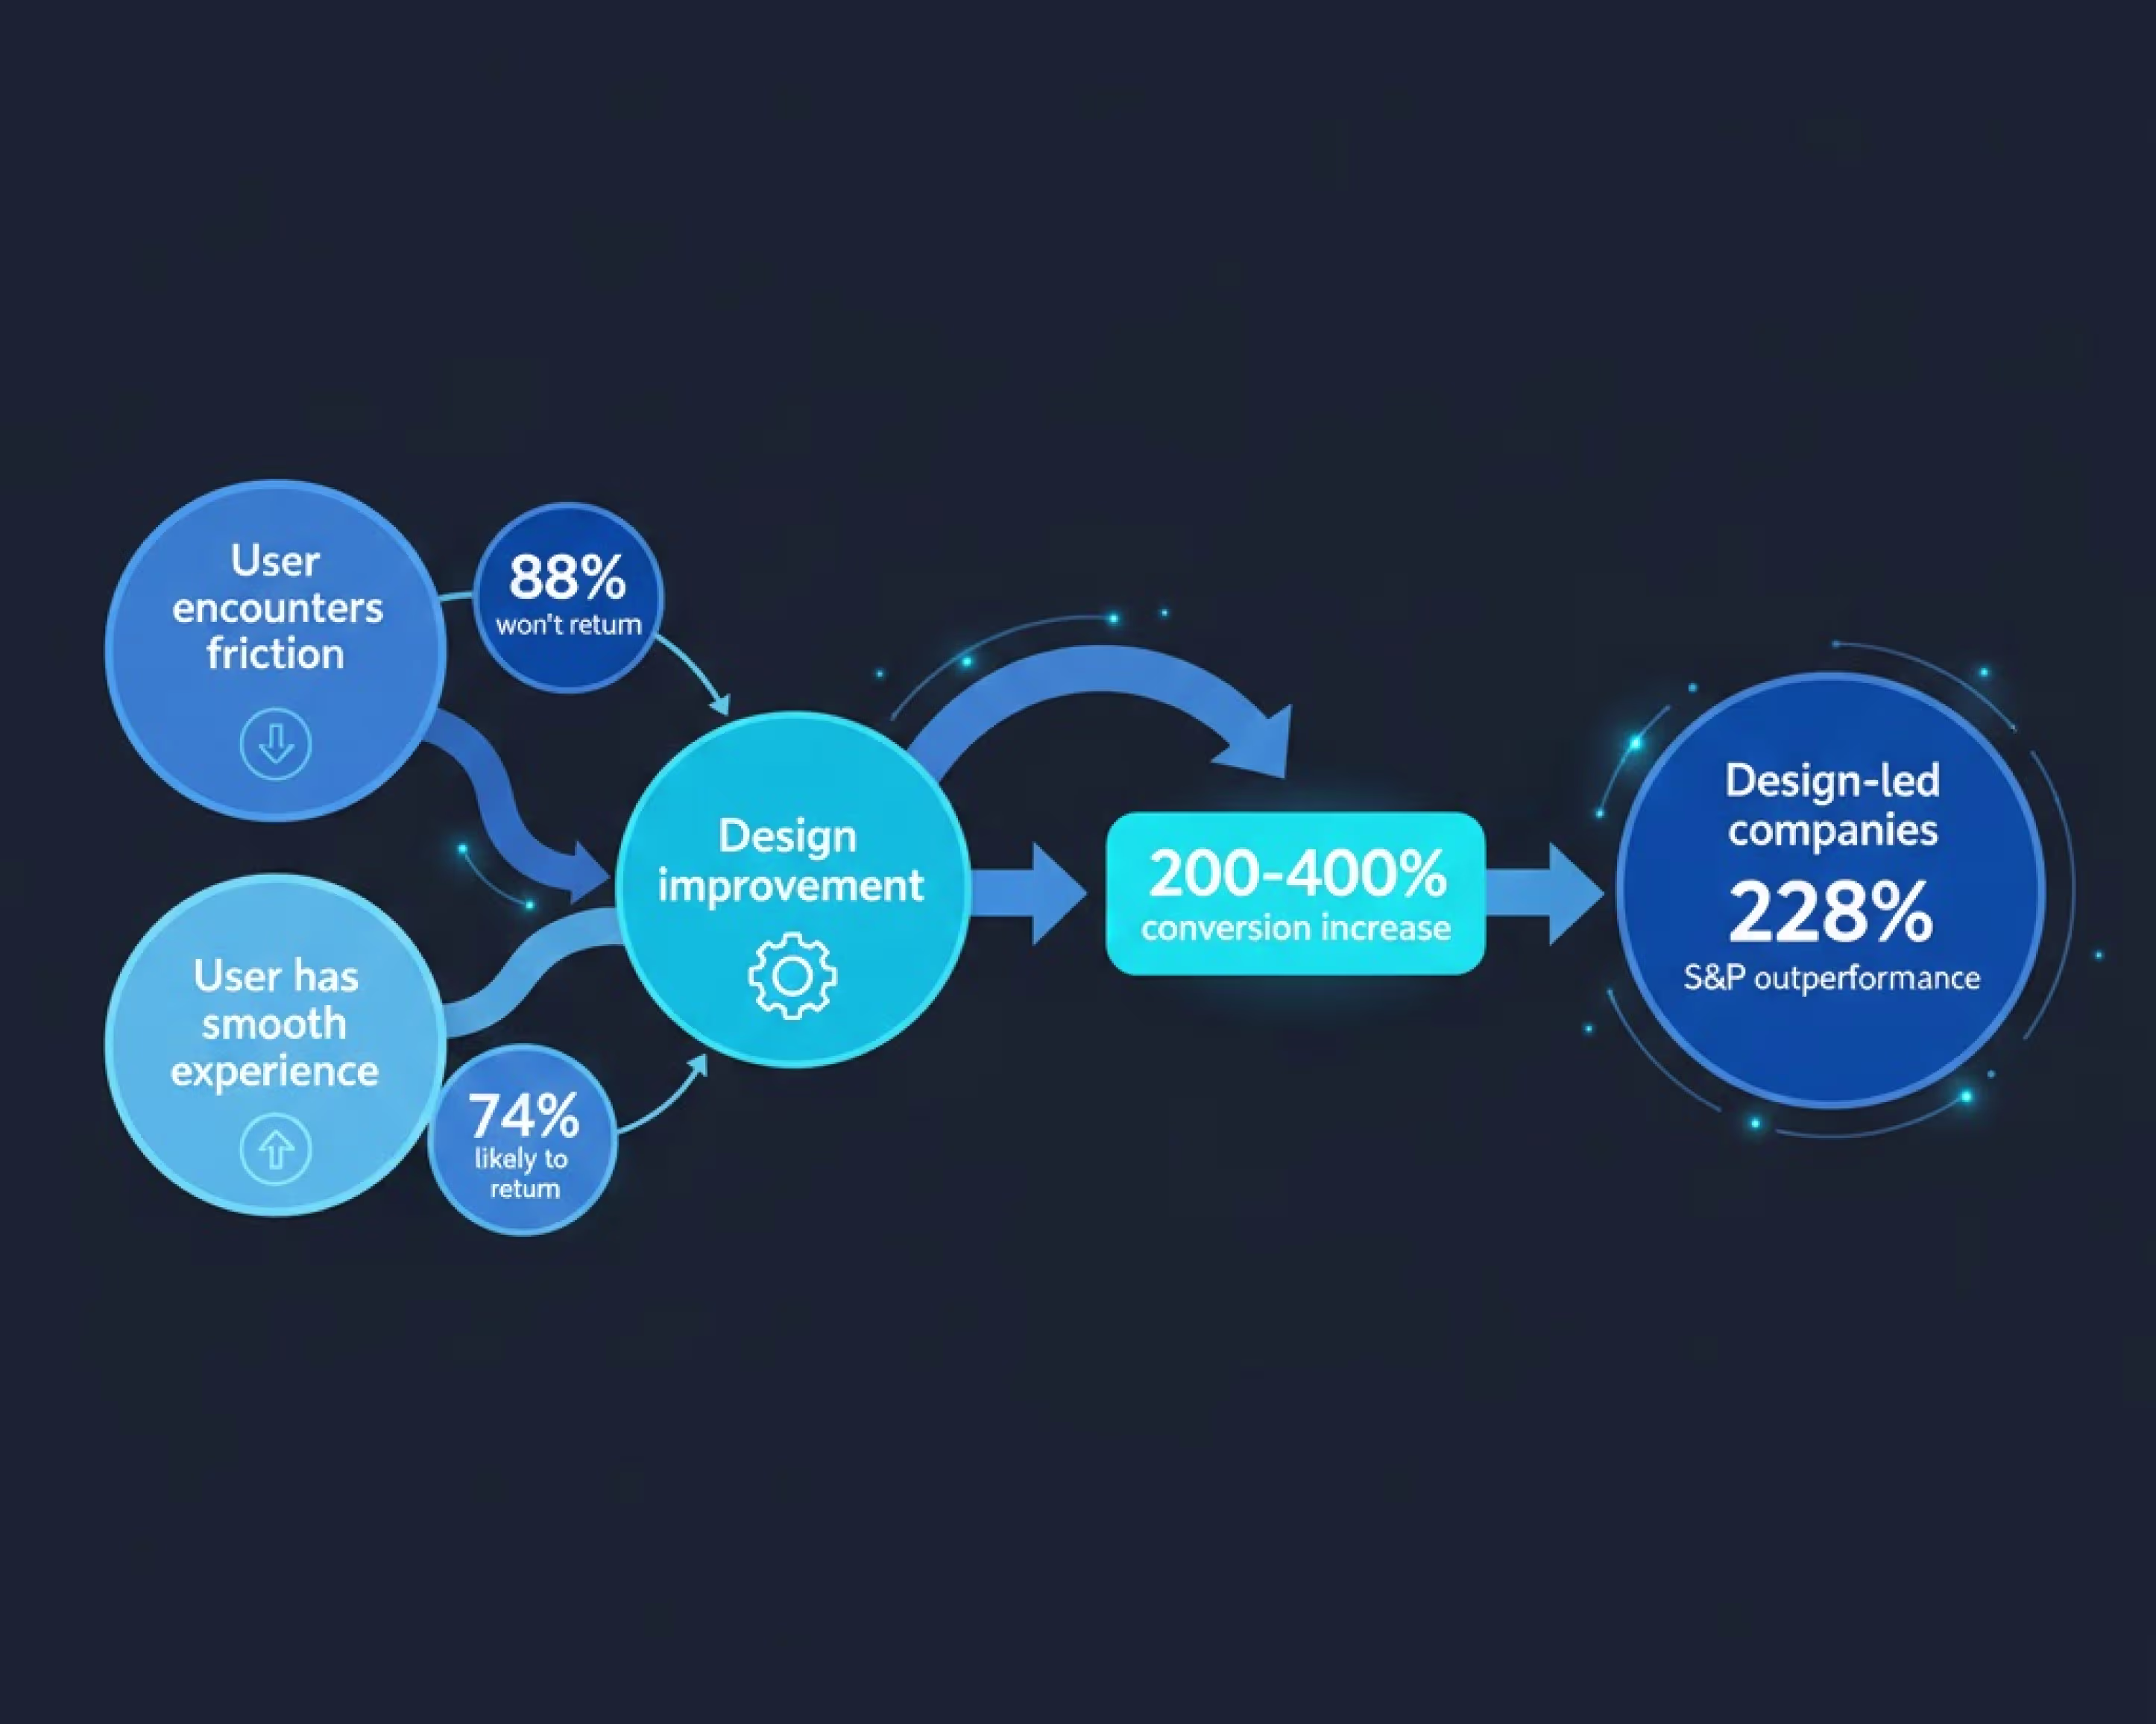
The data tells a pretty clear story. Good UI design can boost conversion rates by up to 200%. A solid UX strategy? That can push conversions up to 400%.
But here's where it gets really interesting. Design-driven companies beat the S&P Index by 228% over 10 years. This isn't just correlation. This is cause and effect.
Why does this happen? Because every single interaction someone has with your product is either moving them toward a purchase, subscription, or engagement or it's pushing them away. A confusing button label? That's money left on the table. A slow-loading page? That's customers going to whoever loads faster.
The UI/UX market itself shows how critical this has become. The global market hit $2.20 billion in 2025 and is projected to grow at 33.35% CAGR to reach $9.28 billion by 2030. Businesses aren't dumping billions into design because it's trendy. They're doing it because it works.
Sites loading in 1 second convert 1.5 times better than those taking 10 seconds. Going from 1 second to 10 seconds on mobile increases your bounce probability by 123%.
One e-commerce company reduced their load time from 17 seconds to 4 seconds. Conversions jumped 41-58% and revenue went up by about 49%. They didn't change their product. They didn't launch some big marketing campaign. They just made their site faster.
Speed isn't just a technical metric. It's a revenue metric.
Cart abandonment sits around 70% across the board. For every 10 people who want to buy from you, 7 change their minds at the last second.
ASOS removed mandatory registration before checkout and added a simple "New to ASOS? Continue" button. That one change cut their abandonment rate in half.
John Stortz & Son merged their three-page checkout into one streamlined page. Conversion rate improved by 3.4% within months.
Research shows fixing checkout UX can boost conversions by 35%. These aren't massive overhauls they're strategic, data-informed tweaks that pay for themselves immediately.
.avif)
Improving UX design to boost customer retention by just 5% can translate to a 25% jump in profit. A 5% retention bump gives you 25% more profit. The math isn't linear it's exponential.
Why? Because getting new customers costs 5-25x more than keeping existing ones. Every customer who leaves because of a frustrating interface represents lost lifetime value, lost referrals, and wasted acquisition costs.
One SaaS company redesigned their onboarding with clearer copy, progress indicators, and contextual help. Trial-to-paid conversions went from 7% to 9.6% a 37% lift. Onboarding completion jumped from 52% to 81%. They didn't change product features. They changed how users experienced those features.
The brutal truth: 88% of people won't come back after a bad user experience. You don't get second chances.
Airbnb redesigned listing pages with bigger photos and simpler booking flows. Result? 25% more bookings and 30% faster time-to-booking.
HubSpot cut lead gen form fields from 15 to 5 essential questions. Form completions went up 42%.
Expedia removed one confusing optional field "Company Name" during checkout. Generated $12 million in additional profit. One field. Twelve million dollars.
Moz surveyed users and followed up with consistent email support. 170% conversion increase and over $1 million in extra revenue.
These aren't years-long redesigns. These are strategic, user-informed decisions that companies tested and rolled out fast.
.avif)
Not all design changes create value. Some hurt your numbers.
The biggest mistake? Designing based on what you think looks good instead of what users need. 38% of people will stop engaging with a website if the content or layout is unattractive. But "attractive" means clear, intuitive, and matching what users expect.
We've seen companies blow six months on gorgeous redesigns that tank conversion rates. Why? They never talked to users. They assumed everyone would love the new look.
What actually works:
Mobile channels are expected to drive 60% of global e-commerce sales in 2026. If your mobile experience sucks, you're losing more than half your potential revenue.
Cart abandonment on mobile hovers near 74.7% because of terrible mobile UX. Three out of four people who want to buy on mobile give up before finishing.
Walmart redesigned their mobile experience with responsive design, faster load times, and streamlined checkout. Result? 98% increase in mobile orders.
The lesson: design mobile-first. Your mobile experience needs to be optimized for how people actually use their phones one-handed, distracted, impatient, and ready to bounce if anything feels hard.
.avif)
For every dollar you put into UX design, you can expect a return of up to $100. That's a 9,900% ROI. Even a fraction of that makes UX one of the highest-ROI investments you can make.
Real example: Your e-commerce site gets 800 visitors per day with a 5% conversion rate and $50 average order value. That's 40 sales and $2,000 daily revenue.
You invest $100,000 in a UX redesign. The redesign bumps conversion to 10% and increases average order value to $55.
Now you're making 80 sales at $55 each: $4,400 per day. That's $2,400 in additional daily profit.
Your $100,000 investment pays for itself in 42 days. Over six months, that's an additional $241,300 in profit. That's 241% ROI.
And these numbers are conservative.
The UX problems costing you the most money aren't always obvious. Here's how to find them:
Companies assume they know what users want, build based on assumptions, and wonder why conversions stay flat. Winners observe, measure, test, and iterate.
Nearly 16% of the world's population over 1.3 billion people live with disabilities. Yet 90% of websites are completely inaccessible to people who rely on assistive technology.
That's not just ethical failure. It's revenue failure.
When you design for accessibility clear contrast, keyboard navigation, screen reader compatibility you're creating a clearer, more usable experience for everyone.
Accessible design overlaps massively with good UX:
Companies prioritizing accessibility expand their market by 16% and create better experiences that convert at higher rates.
70% of Gen Z users want websites to just know what they want. Personalization isn't optional anymore.
35% of SaaS vendors already have AI built in, with 42% planning adoption for personalizing interfaces. AI enables adaptive interfaces that respond to individual behavior in real time.
But technology changes while principles don't. Users still want fast, clear, intuitive experiences. They still want to accomplish goals without friction. They still leave when you waste their time.
Winners in the next five years will:
.avif)
Design isn't separate from business strategy. It is business strategy.
Every pixel, every interaction, every tiny decision in your interface either creates value or destroys it. The companies that get this that measure design impact in revenue, retention, and lifetime value instead of just aesthetics are pulling ahead.
You don't need a complete overhaul. You need to:
The data is clear: good UX isn't a cost. It's an investment with measurable returns. Strategic CTAs can raise revenue by 83%. Better onboarding can improve first-week feature adoption by 61%. Well-executed UI can boost conversion rates by 200%, while seamless UX can push that to 400%.
Your competitors are already doing this. The question isn't whether UX impacts revenue the data proves it does. The question is: how much money are you leaving on the table?